Investment Outlook April 2024
Last month, Europe’s central bankers were busy. Major institutions on the continent displayed a vast range in potential outcomes for monetary policy. Specifically, European Central Bank President Christine Lagarde floated the notion that the ECB would not cut rates...
Last month, Europe’s central bankers were busy. Major institutions on the continent displayed a vast range in potential outcomes for monetary policy. Specifically, European Central Bank President Christine Lagarde floated the notion that the ECB would not cut rates at every meeting this year. Meanwhile, the Bank of England’s remaining hawks capitulated. Finally, the Swiss National Bank (SNB) opened the ball and became the first G10 central bank to cut interest rates.
Global equities have continued to make new highs in 2024. They completed a full V from December 2021 to December 2023, first suffering a loss of 25% in the first nine months of 2022 and then staging an impressive rebound of 35% over the following 15 months. In Q1 2024, global equities achieved an-other gain of 8.2%. In the meantime, analysts have been revising down forward earnings estimates in line with the lackluster readings of global PMIs.
Therefore, staying positioned defensively is the base case. We are leaning towards a low-risk portfolio strategy, with an underweight allocation to equities and credit and higher allocation to government bonds.
BENDURA Investment Policy
| very unattraktive | unattraktive | neutral | attraktive | very attraktive | |
|---|---|---|---|---|---|
| g | g | g | g | g | g |
| Liquidity | b | ||||
| g | g | g | g | g | g |
| Fixed Income | b | ||||
| Government | b | ||||
| Corporate | b | ||||
| High Yield | b | ||||
| Emerging Markets | b | ||||
| Duration | b | ||||
| g | g | g | g | g | g |
| Equities | d | ||||
| United States | d | ||||
| Eurozone | d | ||||
| United Kingdom | d | ||||
| Switzerland | d | ||||
| Japan | d | ||||
| Emerging Markets | d | ||||
| g | g | g | g | g | g |
| Foreign Exchange Rates | |||||
| USD | r | ||||
| EUR | r | ||||
| CHF | r | ||||
| EM Currencies | r |
The terms attractive / unattractive describe the return potential of the various asset classes. An asset class is considered attractive if its expected return is above the local cash rate. It is considered unat-tractive if the expected return is negative. Very attractive / very unattractive denote the highest conviction views of the BENDURA Investment Committee. The time horizon for these views is 3-6 months.
Global Economy
For the regional EU central banks, this was a hectic month. The SNB became the first significant central bank to loosen policy by taking advantage of the first mover advantage and abruptly lowering rates 0.25% to 1.5%. With February’s inflation staying inside the bank’s goal range for the ninth consecutive month, the action was taken to address the decrease in inflationary pressures and the strengthening of the Swiss franc. Analysts speculate that the SNB sought to take the lead and minimize any upward pressure on the Swiss currency by joining the policy easing party later than the Fed and ECB, although having fewer meetings than them. Thus, there was even less need for FX interventions as the EUR/CHF recorded new eight-month highs.
The hawkish stance of Norges Bank placed it at the other extreme. The rate path indicates that the Committee may decide to lower its rate in September, but it also leaves opportunity for a rise in Q2. The Committee maintained its rating at 4.5%. A higher prediction for mainland GDP and lower unemployment indicate a brighter outlook for the Norwegian economy, which places the bank within the more hawkish range of G10 central banks according to its response function.
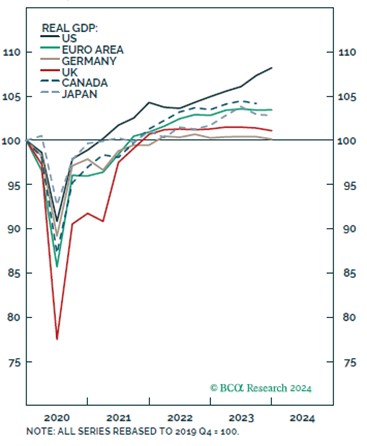
Meanwhile, economists have revised up their forecast of US GDP growth this year to 2.2% (above the Fed’s trend growth estimate of 1.8%), which explains why they have also revised up their expectations for CPI to 2.9%

Chart 1: Except from US, the global growth has stalled. Source: BCA Research, www.bcaresearch.com
Equities
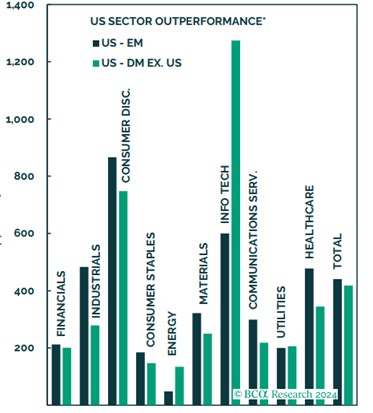
Since ChatGPT’s launch in November 2022 the “magnificent seven” outperformance has contributed approximately 44% to global share price returns. This has also raised concerns because the generative artificial intelligence (GAI) craze enters the “show me the money” phase, therefore the leadership of U.S. stocks will be challenged. However, America’s long-term outperformance is not just a story about GAI or technology in general: in the 15 years since the financial crisis (GFC), all U.S. industries have outperformed their developed and emerging market peers.
European stocks are advantageously priced to benefit from higher global growth compared to their US competitors. The EUROSTOXX 600 forward P/E stands at 13.8, which is still 5% below its mean since 2014, as opposed to the S&P 500, which is 70% above its mean. Today, Europe’s broad market forward P/E ratio offers a 36% discount to that of US stocks, or some of its most appealing pricing since the pandemic. European stocks are a bet on stronger global growth at a cheaper cost than US equities. Secondly, European earnings have already adjusted lower relative to US ones. Specifically, sell-side analysts have already penciled in some earnings growth for US equities, but they see earnings downside for European ones.

Chart 2: US outperformance is not just an AI story. BCA Research, www.bcaresearch.com
Fixed Income
Yields across developed markets have retreated from last year’s highs and are for the most part trading in a narrow range. After bottoming at 3.9% last year, the US 10-year Treasury yield is now about 30 bps higher. The market has dialed back rate cuts more in line with the Fed’s estimate of three cuts this year. This price action was a headwind for the 7–10-year Bloomberg Global Treasury Index, which has fallen 3.3% year-to-date.
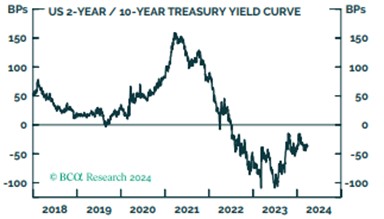
Within government bonds, we recommend a neutral allocation to US Treasuries and an overweight on European government bonds. Policy remains restrictive in Europe, where wage data and labor market dynamics have reduced the right tail for inflation, while the start of a US recession has been postponed by strong momentum in the data, a resilient labor market, and a central bank with a relative greater focus on growth than inflation. A similar comparison also leaves us positive on the UK, as inflation data have been encouraging and we have a more bearish outlook on economies outside the US.

Chart 3: US 2-Year / 10-Year treasury yield curve. BCA Research, www.bcaresearch.com
Commodities and Currencies
Oil prices have risen recently, with spot Brent reaching $86/barrel, compared with a low of $73/barrel in December. This increase was primarily due to widespread weather-conditions and OPEC+ production cuts. Some OPEC+ members have announced expansion of voluntary production cuts to maintain mar-ket stability, but global oil supply will increase in 2024, mainly driven by non-OPEC+ countries.
Gold prices surged 15 percent year on year (YoY) to its all-time-high, supported by the increased de-mand by central banks and the geopolitical risks that benefit a haven like gold, according to a report by the World Gold Council (WGC). Geopolitics has been cited by several analysts as the basis of a medium-term bullish case for gold, amid the wars in Gaza and Ukraine, the upcoming U.S. election and the possibility of recession in major economies.


